Cocoa Analysis: The Price of Your Chocolate Treats will be Expensive

The price of Cocoa continues to rise and betting against the trend of the commodity has likely proven an expensive losing wager for traders who attempted to look for reversals lower.

  • The price of Cocoa as of this writing is near 8431.3 USD per metric ton.
  • To put this value into perspective the cost of Cocoa in October was around the 3352.0 ratio.
  • October’s prices in 2023 were considered a higher range for the commodity, but not one that grabbed headline attention.
  • In November of 2023 when Cocoa started to trade above 4000.0 USD whispers started to grow louder that an escalation of values was building, but still there was not hysteria.

However, Cocoa trading since the 8th of January has taken on a Bitcoin type of feel. Except that while people question the intrinsic value of Bitcoin, the price of Cocoa is not only understood but effects consumers globally. The price of your chocolate is going up. Too put it into perspective the price of Cocoa has doubled since November of 2023.

Surging Prices, Reversals, and Back to Record Highs

Cocoa hit a high of nearly 8540.0 on Monday of this week; yes it reversed lower to 7870.0 USD later in the day, then promptly went higher again, reversed lower and touched a low around 7767.0 yesterday. But then Cocoa burst forward again and is within sight of its all-time highs this morning achieved on Monday. The price velocity of Cocoa is likely melting some speculators.

Traders contemplating a wager in the Cocoa market should consider their ambitions very carefully. The commodity has now entered the terrain of exuberant speculation and is dangerous. Those who want to declare the value of Cocoa is too high, and the price makes no sense are welcome to their opinions, but betting on a downturn to emerge which meet your timeframes may prove damaging to your trading account if momentum continues to push upwards.

Upwards Momentum in Cocoa and the End of the Rocket Ride Higher

For speculators who are betting on additional rocket fueled highs, gambling may be equally dangerous. Day traders need to understand their CFD wagers placed on their brokers’ platforms are not affecting the real price of Cocoa. CFDs are virtual, the real value of Cocoa is only being generated in the cash and futures markets where very large companies and ‘players’ are participating in the commodity. Betting on the price of higher values in Cocoa by day traders needs to be done carefully.

  • The price velocity of Cocoa makes it extremely dangerous for small retail traders to pursue; conservative use of leverage is urged.
  • The ability of Cocoa to end yesterday’s trading within sight of record highs after testing lows only three hours beforehand is evidence that the price of the commodity remains highly volatile.

Cocoa Short Term Outlook:

Current Resistance: 8449.0

Current Support: 8392.0

High Target: 8575.0

Low Target: 8110.0

To get ACCURATE LIVE ACCURATE 2-3 TRADES (Forex/Comex/Stocks) Telegram Financial Advisor

BEST FOREX SIGNAL TELEGRAM GROUP

XAUUSD FOREX INDICES ACCOUNT MANAGEMENT

#SaudiArabia #UAE #Qatar #HongKong #Portugal #PortugueseGP #France #forex #commodities #forexSaudiarabia #forexYemen #forexasia #forexJordan #Singapore #UAE #UK #forexsignals #SwingTrading

GBPJPY–Testing Highs Ahead of Key #UK Economic Data (13 Feb 2024)

  • UK wage growth key to BoE sustainably hitting inflation target
  • GBPJPY struggling near recent highs
  • Divergence points to loss of momentum

The coming days offer several important data points for the UK that could help determine when the Bank of England starts cutting interest rates and, by extension, where the currency is headed in the coming months.

The jobs report on Tuesday is always widely followed but with the unemployment component less reliable than normal, it’s the average earnings that will matter most.

At 6.5% in November, it’s currently running far too high to enable inflation to fall to 2% on a sustainable basis and the BoE will be hoping that it will subside considerably in the coming months, as is expected to have started in December.

A double top at the November and January highs?

The pound has performed very well against the yen recently, as many currencies have, recouping all of December’s losses to surpass the November peak.

GBPJPY Daily

It is continuing to struggle near 189 where it has repeatedly now run into resistance. And on this occasion, it’s done so on much weaker momentum, with there being a notable divergence between the stochastic and MACD, and price.

This could potentially set up a double top in the short term, with the neckline falling at the 1 February low – around 185.23 – a break of which would be a bearish development.


To get ACCURATE LIVE ACCURATE 2-3 TRADES (Forex/Comex/Stocks) Telegram Financial Advisor

BEST FOREX SIGNAL TELEGRAM GROUP

XAUUSD FOREX INDICES ACCOUNT MANAGEMENT

#SaudiArabia #UAE #Qatar #HongKong #Portugal #PortugueseGP #France #forex #commodities #forexSaudiarabia #forexYemen #forexasia #forexJordan #Singapore #UAE #UK #forexsignals #SwingTrading

Sentiments Turned Cautious on Yields and Infections, But Stay Positive

US treasury yield jumped last week after Fed gave way to more yield strength. In the background, there were some concerns over resurgence of coronavirus infections in some countries like France, Brazil and India. There was also risk of slower than originally expected vaccine rollouts. Tensions between US China heightened after the “diplomatic” talks in Alaska. Yet, overall, investors were rather unmoved by the negative news. There was no synchronized free fall in stocks, and overall sentiments were just cautious, but still positive.

Yen, Swiss Franc and Dollar ended as the best performers last week but all closed inside prior week’s range only. Dollar lacked committed buying to extend it’s corrective rebound. Though, Yen crosses look ready for a near term pull back. Euro and Sterling ended as the joint weakest.

10-year yield’s up trend on track to 2% handle

10-year yield broke out of range and surged to as high as 1.754 last week, before closing strongly at 1.732. While TNX is clearly overbought (bond oversold), as seen in daily and weekly RSI. There is no sign of topping yet, and the up trend should continue as long as 1.5785 support holds.

Nevertheless, on next rally, it could enter in to an important resistance zone. First, there is 1.971 structural resistance. Second, there is 55 month EMA at 1.998. Third, there is 61.8% retracement of 3.248 to 0.398 at 2.159. Additionally, 2% handle should be an important psychological level. These should be the levels that traders are looking at.

For now, we’re not expecting much drastic reactions in other parts of the markets to further rally in 10-year yield, unless the above mentioned resistance zone is taken out firmly (which we don’t expect to happen in the near term).

Stocks in consolidations at worst, despite surging yields

By drastic reaction mentioned above, we mean, for example, broad based free fall in stocks. That hasn’t happened in the past few weeks despite the steep rise in treasury yields. The lack of synchronized decline in major US indices suggests that the markets are at worst entering into a consolidation phase, rather than a medium term correction

DOW actually made new record high as 33227.78 and matched 61.8% projection of 18213.65 to 29199.35 from 26143.77 at 32932.93. Daily MACD suggests that it might be in upside acceleration phase again. Friday’s pull back was just shallow by technical standard. As long as 32009.67 resistance turned support holds, we’d still expect more record highs ahead.

The “leading” NASDAQ continued to trade in range and was starting to gyrate around flat 55 day EMA. Price actions from 14175.11 could be developing into a sideway consolidation pattern. As long as 12074.06 cluster support holds, (61.8% retracement of 10822.57 to 14175.11 at 12103.24) holds, this is our favored case. However, firm break of this cluster support will argue that NADSAQ might have started a correction to back to 10822.57 support. That might be a early sign that deeper pull back in risk sentiment, and in DOW and S&P 500, is underway.

Dollar index extending corrective pattern from 89.20

Dollar index stayed in sideway consolidation last week as the recovery pattern from 89.20 extended. There was no committed buying to push it through prior week’s high at 92.50. Further rise might be seen ahead as long as 90.63 support holds. But DXY will firstly need to overcome 55 week EMA at 93.45 decisively, to indicate that it’s ready for a bullish trend reversal. Otherwise, we’re treat the current recovery as a corrective move, with medium term outlook staying bearish.

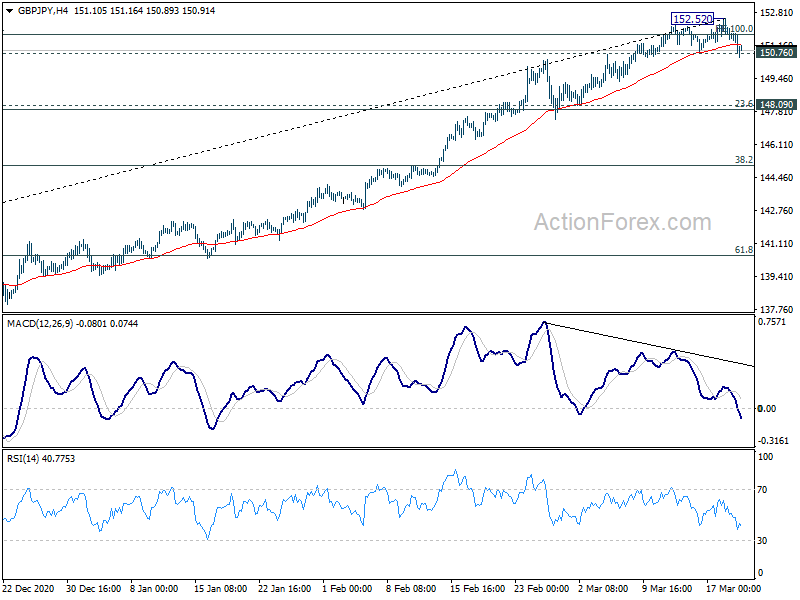
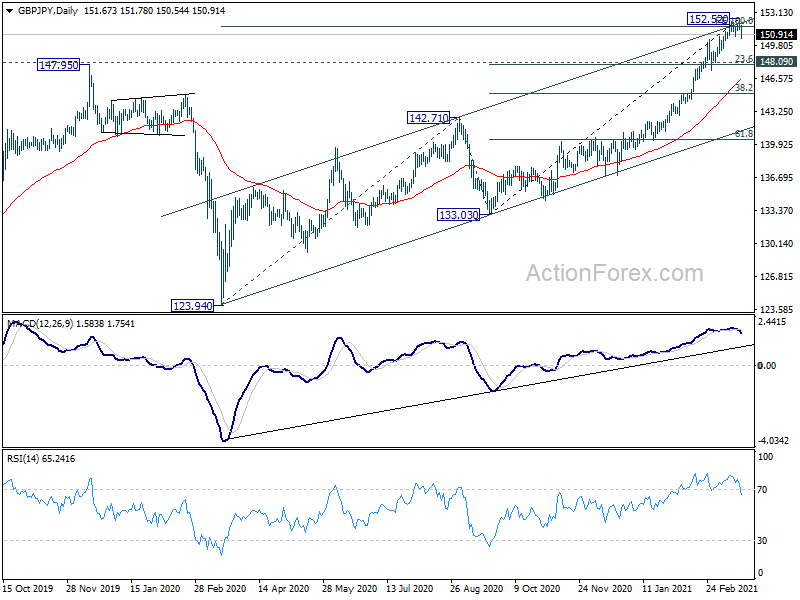
GBP/JPY and CAD/JPY turning into consolidations

If the stock markets turn into consolidative mode, some Yen crosses might follow. In particular GBP/JPY struggled to break through a key resistance between 100% projection of 123.94 to 142.71 from 133.03 at 151.80 and medium term channel resistance. The late breach of 150.76 minor support suggests short term topping, with bearish divergence condition in daily 4 hour MACD. Deeper retreat could be seen for the near term. But we’d expect strong support from 148.09, 23.6% retracement of 133.03 to 152.52 at 147.92 to contain downside, and set the range of the consolidation.

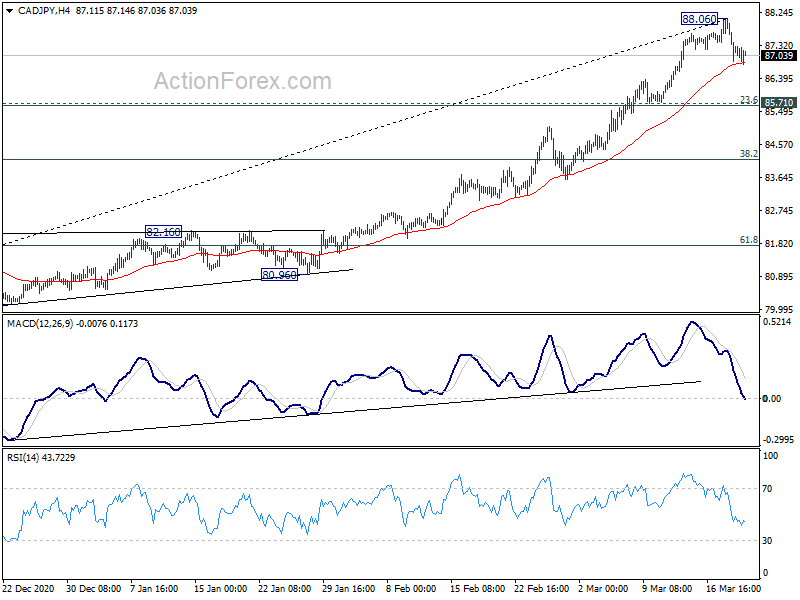
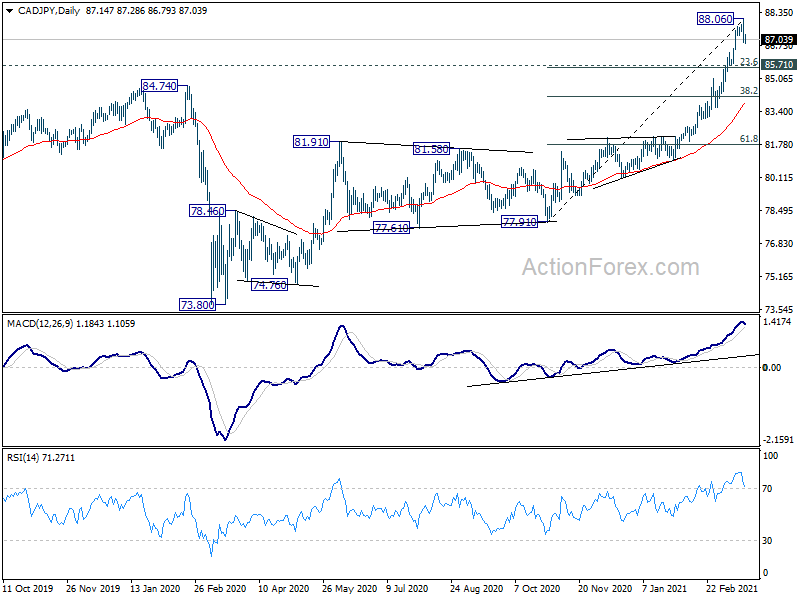
CAD/JPY could have formed at short term top at 88.06 too. Deeper pull back might be seen for the near term. But we’d expect strong support from 85.71, 23.6% retracement of 77.91 to 88.06 at 85.66 to contain downside, and set the range of the consolidations.

Nevertheless, firm break of the mentioned cluster support level for GBP/JPY and CAD/JPY could indicate that broader risk correction is underway, which would be reflected in the development in selloff in stocks, and likely stronger rally in Dollar index.

AUD/USD Weekly Outlook

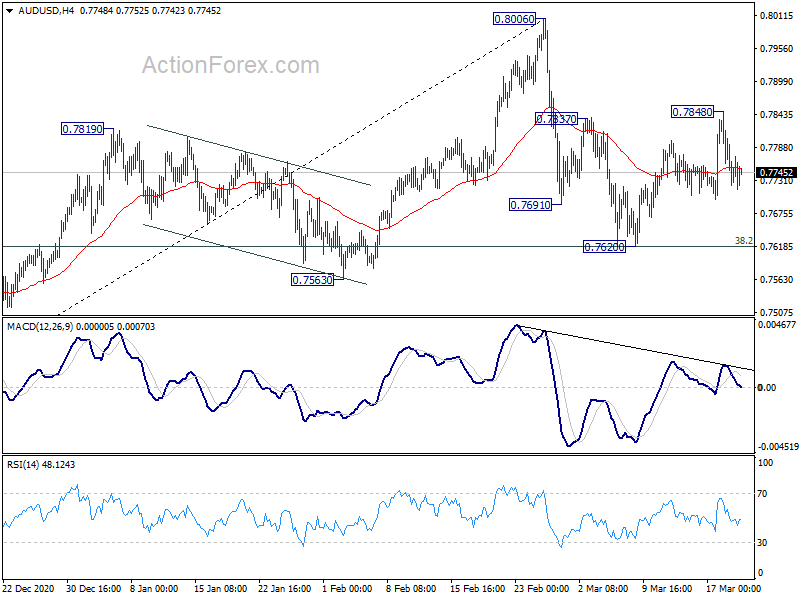
AUD/USD recovered to 0.7848 last week but failed to sustain above 0.7837 resistance and reversed. Initial bias remains neutral this week first and correction from 0.8006 could extend further. On the upside, above 0.7848 will bring retest of 0.8006 high. However, break of 0.7629 support will resume the fall from 0.8006. Firm break of 0.7563 will indicate that deeper correction is underway, back towards 0.7413 resistance turned support.

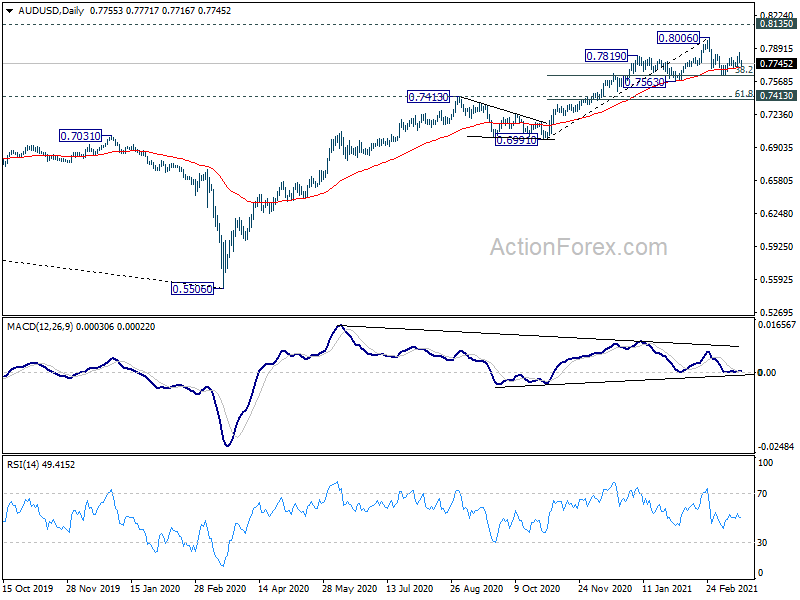
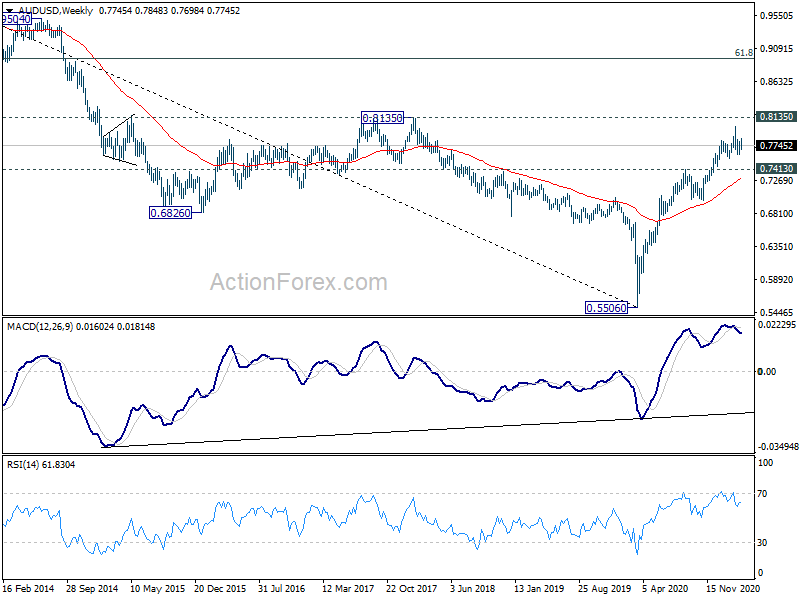
In the bigger picture, whole down trend from 1.1079 (2001 high) should have completed at 0.5506 (2020 low) already. Rise from 0.5506 could either be the start of a long term up trend, or a corrective rise. Reactions to 0.8135 key resistance will reveal which case it is. But in any case, medium term rally is expected to continue as long as 0.7413 resistance turned support holds.

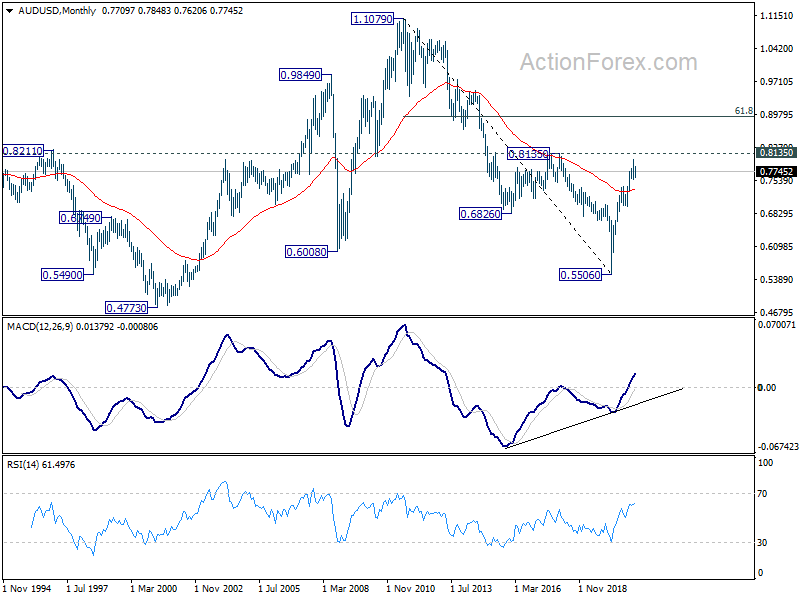
In the longer term picture, 0.5506 is a long term bottom, on bullish convergence condition in monthly MACD. Focus is now back on 0.8135 structural resistance. Decisive break there will raise the chance that rise from 0.5506 is an impulsive up trend. Next target should be 61.8% retracement at 0.8950 and above. Though, rejection by 0.8135 will keep the case of medium to long term sideway consolidation open.

Follow me on the telegram for the latest news, tips, and various other information: Financial Advisor

In our Forex/ Commodity services:

  • you will get 3-5 signals on a daily basis of both the forex and Commodity market.
  • Signals will be of an intraday kind.
  • Our winning accuracy is of 85% minimum side.
  • All the signals will be provided with proper entry price, target price, and stop loss.

#SaudiArabia #UAE #Qatar #HongKong #Portugal #PortugueseGP #France #forex #commodities #forexSaudiarabia #forexYemen #forexasia #forexJordan #Singapore #UAE #UK #forexsignals #SwingTrading #forexpoland #forexfrance #forexgermany #forexsingapore #forextokyo #forextaiwan #forexindonesia #forexhongkong

FX news wrap: Canadian dollar hits 3-year high on strong jobs

Forex news for North American trade on March 12, 2021:

• Canada February employment +259.2K vs +75.0K expected
• U Mich March prelim consumer sentiment 83.0 vs 78.5 expected
• US tops 100m vaccine doses administered
• Baker Hughes US oil rig count 309 vs 312 expected
• Most of Italy to enter lockdown on rising cases
• ECB sparred over impact of US stimulus yesterday – report
• US PPI final demand for February YoY +2.8% vs 2.7% estimate

Markets:

  • Gold flat at $1721
  • S&P 500 flat at 3940
  • US 10-year yields up 9 bps to 1.63%
  • WTI crude down 42-cents to $65.61
  • CAD leads, NZD lags

The rise in Treasury yields had markets off-balance coming into the day but this time was indeed different. A strong consumer sentiment report was a reminder of all the stimulus and reopening that’s coming. Even as US 10-year yields rose above 1.62% to a pandemic cycle high, the jitters were minimal.

The main trade was to sell the US dollar and ignore the rise in yields, which is very counterintuitive to what’s been the norm, and suggests that flows are flowing.

The Canadian dollar made a big move even as its commodity cousins struggled. The Feb jobs report was much stronger than expected with unemployment falling by a full point. USD/CAD initially dropped to 1.2510 from 1.2540 then had second thoughts and rebounded. But after Canadian 5y rates started to run, so did the loonie and then the dominoes fell through 1.25 and the Feb low of 1.2468.

Cable had been sold hard in Asia and Europe but came up for air to trim the daily decline by 60 pips. The euro made a similar move and is wrapping up the day at the US highs, though still below 1.20.

USD/JPY finished the day up 50 pips to 109.00 and tried the downside briefly but even on a day when the dollar was soft, it wasn’t soft enough to fall against JPY.

Overall, it was a tough day to connect the dots and it will get even tougher in the run-up to Wednesday’s FOMC.

What a ride it was this week. Have a great weekend.

Follow me on the telegram for the latest news, tips, Signals, and various other information: Financial Advisor

In our Forex/ Commodity services:

  • you will get 3-5 signals on a daily basis of both the forex and Commodity market.
  • Signals will be of an intraday kind.
  • Our winning accuracy is of 85% minimum side.
  • All the signals will be provided with proper entry price, target price, and stop loss.

#SaudiArabia #UAE #Qatar #HongKong #Portugal #PortugueseGP #France #forex #commodities #forexSaudiarabia #forexYemen #forexasia #forexJordan #Singapore #UAE #UK #forexsignals #SwingTrading #forexpoland #forexfrance #forexgermany #forexsingapore #forextokyo #forextaiwan #forexindonesia #forexhongkong

Asian Open: Copper Sends Commodity FX To New Highs:

AUD and NZD pairs rallied into the weekly close on Friday as commodities and, in particular copper, pushed aggressively higher.

Commodities chalked up another broad rise last week, with the CRB index (commodities index) rising for a fourth consecutive week and closing at its highest level since November 2018. The index is a basket of 19 commodities ranging from energy, agriculture and metals and is a good barometer for inflationary pressures. And the index has risen by over 30% since the March lows then markets are clearly pricing in inflation.

But it was copper prices which stole the show after its bullish run increased its magnitude and closed above $4 for the first time since August 2011. Gaining an impressive 7.5% last week alone, upside pressures increased due to demand optimism for copper as Chinese investors returned to their desks.

Gold remains unloved after breaking beneath key support at 1764 and producing a bearish engulfing week. However, Friday’s bullish outside candle suggests the potential for a little mean reversion from recent lows, with 1800 being the next obvious target.

WTI closed the week back below $60 and has formed a bearish hammer on the weekly chart. Brent closed at 62.91 and formed a bearish pinbar on the weekly chart. With prices looking stretched to the upside and signs that the Texas freeze is thawing, we are on guard for a potential correction from current levels.

Commodity currencies rally

The Australian dollar was the strongest major last week, with most of its gains coming through on Friday as copper broke to new highs. Closing the week at its most bullish level since March 2018 and just shy of 0.8000 one must question at what point the RBA will try and jawbone their currency. Whilst AUD was the strongest, commodity FX in general enjoyed a weaker dollar environment, with CAD, NZD and MXN also pushing firmly higher against the greenback.

The British pound closed above 1.4000 and at its highest level since April 2018. Confidence of a faster vaccine rollout remains a key driver behind the pound’s strength, although any bumps in the road regarding vaccinations are likely to show up in price action too.

Further signs of a weaker dollar emerged on the yen. A bearish hammer has formed on the USD/JPY weekly chart after a failed break above its 50-week eMA, so we question whether the high may already be in place.

Weekly repositioning for FX majors was relatively light, with all futures seeing less than 10k contracts changed compared with the prior week. The largest weekly change was seen on Japanese yen futures where traders increased their net-bullish exposure by 9.4k contracts (2.6%)

Interestingly, traders reduced net-bullish exposure to the Swiss franc by -13.1%. Given the strength of CHF pairs over recent weeks and the temporary break above 118 on CHF/JPY, perhaps traders are increasingly concerned that the SNB (Swiss National Bank) will intervene to weaken their currency. This means net-long exposure to Swiss franc futures are their least bullish since July 2020.

Net-long exposure to copper futures remained just below record highs. Although bullish exposure may well now be at a record level given the explosively bullish price action in the second half of last week.

Despite gold’s weaker performance over the last few months traders remain overwhelmingly net-long, with bulls outnumbering bears by a ratio of 4.4:1. However, short interest increased by its largest amount in four months last week.

GBP/NZD rolls over at its 200-day eMA

A potential bearish swing trade may have formed on GBP/NZD. The weekly chart remains in a longer-term downtrend and produced a bearish pinbar, after Friday’s bearish engulfing candle eradicate all gains seen between Monday and Thursday. A break beneath last week’s low (1.9167) confirms the bearish reversal candle.

We can see on the daily chart that a bearish engulfing candle saw prices roll over at the 200-day eMA. This average was last tested in October where a bearish engulfing candle also formed ahead of -6.5% decline.

Switching to the four-hour chart shows prices broken below a bullish trendline which suggests a change in trend. Given the decline stopped just above the 1.9160 swing low, we see the potential for a minor rebound from current levels. Yet this may provide an opportunity to fade into the rebound and target lower support levels.

  • Bears can seek to fade into minor rallies above 1.9160.
  • The broken trendline or the 38.2% Fibonacci retracement level could aid with trade entry level.
  • A break below 1.9160 brings 1.9000 into focus.
  • It is a quiet start to the week for Asian economic data.
  • Christine Lagarde speaks at the European Semester Conference at 00:45 Tuesday morning.

Watchlist update:

USD/JPY: Removed from watchlist. Prices broken beneath 105.75 to invalidate the original bullish bias.

CHF/JPY: Prices failed to hold above key resistance around 118.60 and produced a weekly bearish pinbar and a bearish engulfing on Friday. The near-term bias remains bearish below Friday’s high and potential targets include 117 and the low around 116.13 – 27.

GBP/CHF: The breakout from its basing pattern has performed well and is already over halfway to hitting its longer-term target around 1.9000. We continue to favour longs upon low volatility retracements or breakouts to new highs. The near-term bias remains bullish above the 1.2490 swing low (H4).

Do join now for premium Analysis and Signals: Financial Advisor

Get live support with our Experienced research team for #forex #XAUUSD pairs.

Our #forex #xauusd #Indices services.

Step 1: Test our 2–3 trials #SignalsStep 2: Pay for #VIP services

Who offers the highest performing gold trading signals?
What is the best Forex signal Telegram group?
How much can forex traders make a day?
What is the best Forex signal WhatsApp group?

#SaudiArabia #UAE #Qatar #HongKong #Portugal #PortugueseGP #France #forex #commodities #forexSaudiarabia #forexYemen #forexasia #forexJordan #Singapore #UAE #UK #forexsignals #SwingTrading #forexpoland #forexfrance #forexgermany #forexsingapore #forextokyo #forextaiwan #forexindonesia

#SaudiArabia #UAE #Qatar #HongKong #Portugal #PortugueseGP #France #forex #commodities #forexSaudiarabia #forexYemen #forexasia #forexJordan #Singapore #UAE #UK #forexsignals #SwingTrading #forexpoland #forexfrance #forexgermany #forexsingapore #forextokyo #forextaiwan #forexindonesia